TL;DR I couldn’t figure it out mainly because Linux, Vim and LocalWP seem to be a combination which isn’t officially supported.
Starting off:
I mainly got the start of my Vdebug setup from this article.
I am currently in the point where Vdebug is working on F10 and F5 press but I have yet to get the php.ini file on the site’s directory working well. Where is this file? Based on the solutions of this article.
I’m looking at ‘~/Local\ Sites/matlack-2/conf/php’ folder for the file and the file I’m looking at is called ‘php.ini.hbs’. I scrolled to the bottom of the file and see 4 lines related to xdebug.
I’m trying to figure out the local ip address and if it’s different than like, external.
I’m looking into using solutions from this article: https://linuxways.net/mint/5-ways-to-find-your-private-ip-address-in-linux-mint-20/
I put a slash after the local ip, I’m taking it off to see what happens.
I still hooked it up and didn’t get much of results. The Vdebug didn’t kick in so looking for other resources.
I’m still having an issue with Vdebug not connecting.
Based on a Stackoverflow article I think I’m having port issues.
Or I may have been working on the wrong php.ini file. But I read this article on LocalWp and now I think it may be port issues.
I’m getting haunted by this message, ‘Waiting for a connection: none found so far ‘
I’m not getting very far with this, so I think I’m going to install VS Code (temporarily) install the extensions and debug and then transfer that logic to Vdebug.
New Day: Mon 08 Aug 2022 06:52:51 AM CDT
I have tried to install the extension on my Linux Mint machine to not much avail. It’s stuck on the install. So I think I’m going to to run php in other places on my machine outside of WordPress. But right not I am currently reading through the help section of vdebug with :help Vdebug.
The help files says I have to look for a .so something or a library but I’m not finding it.
This StackOverFlow answer helped me in locating the .so file.
I am currently using this installation wizard page which is returning me with helpful details. I am unsure if this has to do with Vdebug but hey, what do I have to lose?
The page asks for the output of phpinfo() and to copy and paste that into the webpage so I’m running this bit of code in my functions.php
$foo = 5;
if($foo == 5){

  echo "<h1>Statement</h1>";
  phpinfo();
}
Then, I am just copying and pasting the output. Their maybe security holes in copying and pasting info like that but honestly, I don’t care.
Okay, I tried a bunch of other solutions didn’t work so I tried to do a breakpoint but on the local file I made on my desktop test.php when I press f5 on a f10 made breakpoint it says ‘socket’ already in use.
I read a Stackoverflow comment saying: P.S. If you are using Xdebug inside the docker then you should not use localhost for client_host. Use what Docker says: host.docker.internal. But I think other people using local wp use that.
I also found this command for Linux ‘sudo lsof -i :9000’ it outputs to the terminal information about the port and what is listening to it.
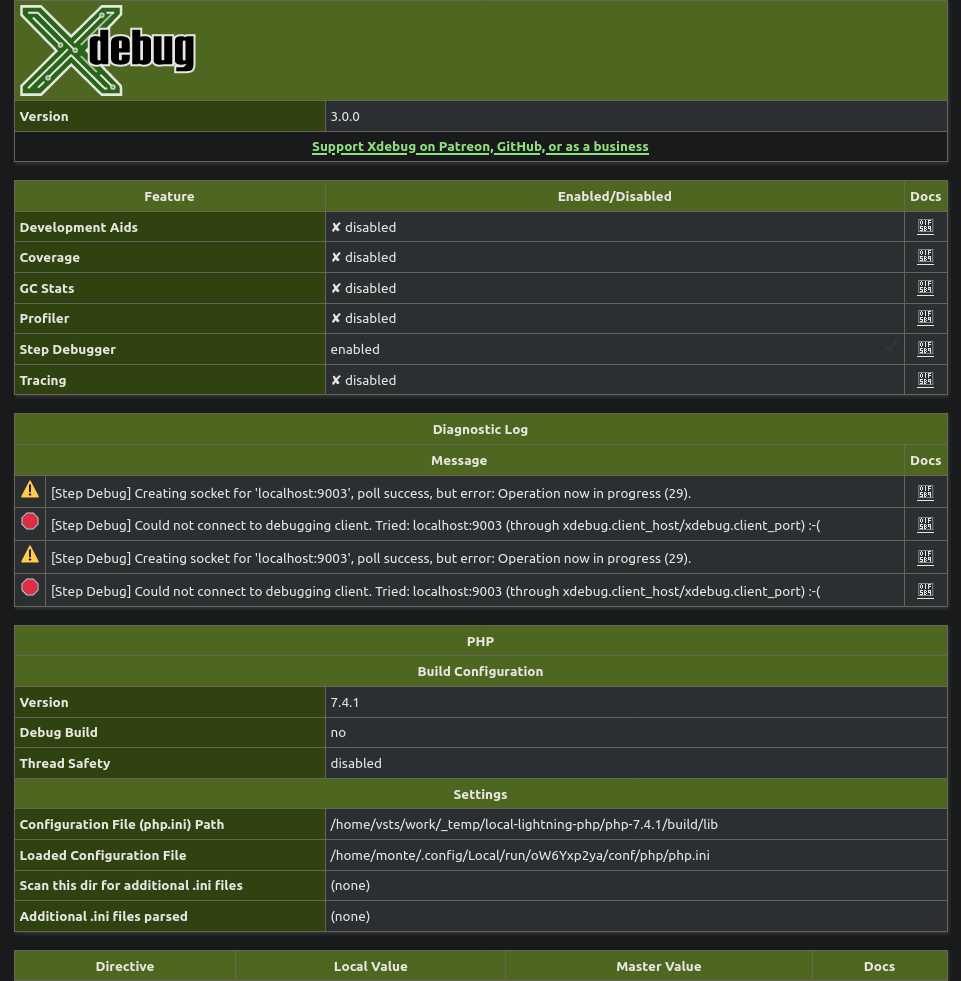
I ran xdebug_info(); and the screen I got says step debugger disabled. This is strange because I thought I enabled it.
So let’s figure out why it’s disabled.
It is not as easy to change it to debug as in other non LocalWP setups because LocalWP is in a Docker container.
Okay, I turned step debugger on. By adding xdebug.mode = debug to my php.ini.hbs file and not focusing on the general php.ini file. Itms (If that makes sense)
But I am still getting error messages and a few of them are red error messages so I have to examine that. The error messages say:
[Step Debug] Could not connect to debugging client. Tried: localhost:9003 (through xdebug.client_host/xdebug.client_port) 🙁
[Step Debug] Could not connect to debugging client. Tried: localhost:9003 (through xdebug.client_host/xdebug.client_port) 🙁
I am trying to run the debugger through port 9001.
Okay I changed the client port to 80 and now my php.ini is looking like the following:
remote.localPortHost=allInterfaces

xdebug.remote_enable=1
xdebug.remote_connect_back=On
xdebug.remote_port=9001
xdebug.profiler_enable=1
xdebug.remote_autostart=true
xdebug.remote_handler=dbgp
xdebug.remote_mode=req
xdebug.remote_host=localhost

xdebug.client_host=localhost
xdebug.client_port=80

xdebug.mode = debug
xdebug.start_with_request=yes
xdebug.discover_client_host=1
However, I still get no stoppage at the breakpoint.
I think the issue may lay in path_maps var.
I read this GitHub thread where it may be the issue.
Logging out:
New Day: Tue 09 Aug 2022 08:27:00 AM CDT
Okay, working on path_maps
Going back to the original article I was reading to start off this process. To review the path_maps var.
I’ve tried many ideas and for the most part I’m running out of options with my current setup. So I think I’m going to wipe my system install LocalWP extension from a fresh install. But the extensions may not work on Linux. So, I think I’m going to run a xampp server that’s not on a LocalWP machine.
I am now attempting to use Neovim for the debugging process as it relates to the article I started this documenting article off with. But at the same time I have to run a bunch of installs and I don’t feel like doing that atm.
I’ve changed my mind, I’ve started the process of trying to get it work with vs code. I tried to initally install it with the extensions thing on the LocalWP app but it didn’t work so I installed it manually through their GitHub repo.
I am now looking at YouTube tutorials of how they set up VS Code with Xdebug and LocalWP. I imagine this process is going to be tougher for me cause I already have set up and not starting from scratch.
Um yeah, like I thought, so I’m having router issues. So what I’m going to do is wipe my mint setup. But still have vim and debug with VS Code.
I am using this article to go through the process of wiping Linux Mint.
I read some of that stuff, got lazy and I think I’m just going to boot of a USB thumb drive and reset it there.
Okay, I have the fresh install of Linux Mint and not I’m re-installing the LocalWP Xdebug extension.
Ok, so I installed the extension manually through GitHub and I didn’t have a site. So I made a site but the site said I had routing issues. Then I looked up how to fix it the solution said to change the routing from Site Domain to localhost and I did and then the site worked again.
Ok, I am now going through this YouTube tutorial to try and get Xdebug working on VS Code.
I did all of what was explained in the video and it still didn’t work.
I looked on this article for answers and it now works!
Logging out: Tue 09 Aug 2022 05:14:34 PM CDT
New Day: Wed 10 Aug 2022 08:45:18 AM CDT
Today, I have VS Code working with debugging Xdebug but it’s showing error which is strange to me. I am unsure whether it is related to a certian watch config or all configs are affected.
My current xdebug_info()
I am starting to think that… If I would’ve changed my routing scheme to Localhost when I was trying to use Vdebug it might’ve worked.
However, I have been behind on work for the past couple of days trying to figure this stuff out so I think I’m going to go back to that and only update it on a necessary basis.
Concluding for now: Wed 10 Aug 2022 09:43:01 AM CDT
New Day: Sat 13 Aug 2022 02:17:56 PM CDT
Okay, I tried to turn off the extension and Vdebug in an effort to speed up my site after concluding I won’t be using it. Then, their was bunch of errors popping up saying that their was issue with the routes again. So I just uninstalled LocalWP and installed it again without Xdebug VSCode Extension.
Okay, I am now actively advocating against getting Xdebug or Vdebug or anything of the sort for the forseeable future as the support and issues I have are too much to deal with for LocalWP’s docker thingamajig. So if you would like to use Xdebug or Vdebug DON’T use it on Linux because the past professional week of my life with the exception of learning more about debugging and writing like 5 articles on the topic has been wasted trying to make it work.
So follow my saga on how to try to debug with log files and do the same thing I was trying to do with Xdebug.
Documenting: Debugging With Custom Log Files
Concluding for now: Sat 13 Aug 2022 02:30:07 PM CDT